White Sands Townhomes Market Report

or Create your own market report

White Sands Townhomes market report Pensacola Beach

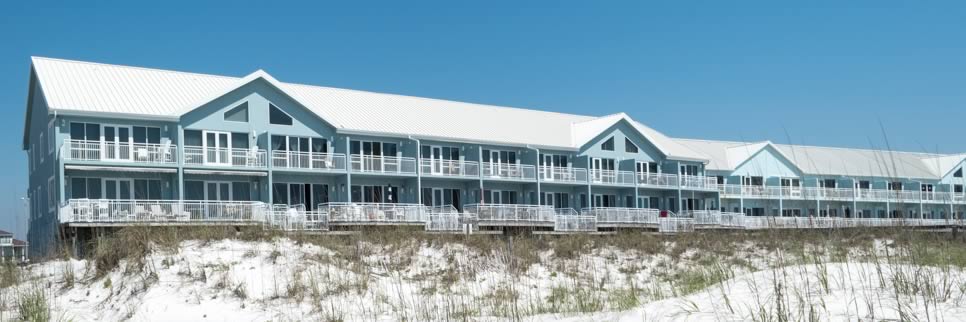
The market report below contains the most recent "Active Properties", "Properties Under Contract", and "Sold Properties" at the White Sands Townhomes in Pensacola Beach, over the past twelve month period.

Use this link to return to the White Sands Townhome Sales page.

You can make a Custom Market Report for any city, area or property type. Give it a try, you will see how easy it is to keep up sales events using this valuable condominium listing and sales tool.

Active Properties
Address Beds Baths Living ft2 List Price Cost per ft2 DOM
533 Ft Pickens Road N/A N/A N/A $395,000 Unknown 98 days
533 Ft Pickens Rd N/A N/A N/A $395,000 Unknown 99 days
457 Ft Pickens Rd 4 3 2,145 $1,600,000 $745.92 21 days
Average: 4.0 3.0 2,145 $796,666 $745 21 days
Viewing 1 - 3 of 3
Viewing 1 - 3 of 3
Sold Properties
Address Beds Baths Living ft2 List Price Sold Price Cost per ft2 DOM Sold Date
421 Ft Pickens Rd 4 4 2,300 $1,300,000 $1,320,000 $573.91 1 day 4/12/23
529 Ft Pickens Rd 3 3 2,570 $899,000 $840,000 $326.85 146 days 1/12/23
439 Fort Pickens Rd Road 4 3 2,300 $1,400,000 $1,375,000 $597 1 day 1/6/23
439 Ft Pickens Rd 4 3 2,300 $1,400,000 $1,375,000 $597.83 1 day 1/6/23
Average: 3.8 3.2 2,367 $1,249,750 $1,227,500 $524 49 days
Viewing 1 - 4 of 4
Viewing 1 - 4 of 4

Vendor Member Number : 28166